Note
Click here to download the full example code
Visualising Word Counts
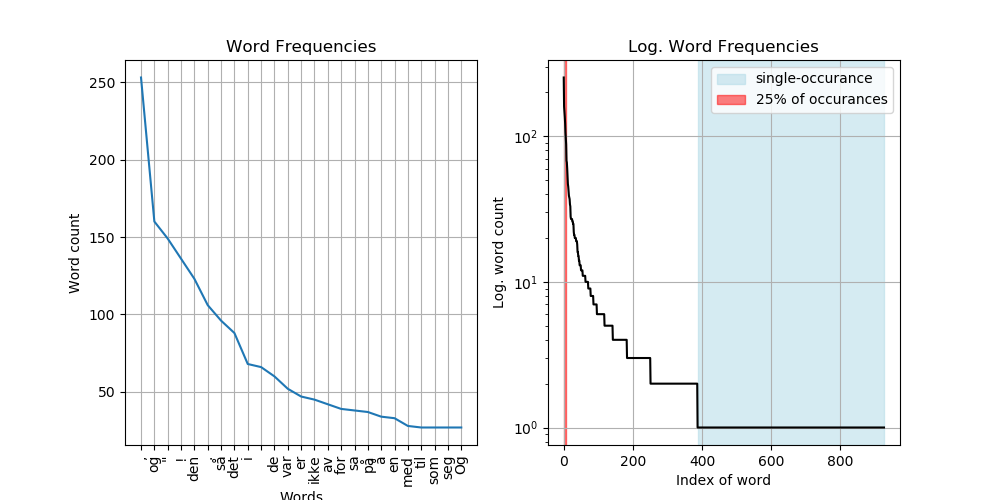
The following example takes a raw extract of norwegian texts, removes stopwords and lemmatizes prior to analysing the distribution of the words in the text.
import enlp.visualisation.freq_distribution as viz
import enlp.understanding.distributions as dists
import enlp.processing.stdtools as nlp
import spacy
import matplotlib.pyplot as plt

plt.close('all') # very important for read the docs to avoid it crashing due to memory
Load Spacy’s Norwegian language model and the example text
langmodel = spacy.load('nb_dep_ud_sm')
with open("example_data/no_den_stygge_andungen.txt", "r") as file:
    text=file.read()
Make strings into list of tokens and count them
Visualise

Out:
/Users/clbi/Documents/eNLP_all_folders/eNLP_fork/eNLP/examples/ex_visualise_distribution.py:32: UserWarning: Matplotlib is currently using agg, which is a non-GUI backend, so cannot show the figure.
  plt.show()
Total running time of the script: ( 0 minutes 1.020 seconds)